

Top Agile Metrics for Effective Team Management
Oct 28, 2019
The introduction of agile has transformed the way companies work. Agile has worked wonders for firms, and the positive effects are out in the open—shorter time to market and lower costs, just to name a few. But companies can’t take advantage of the full benefits of agile just by making the switch. Without bringing agile metrics into the picture, using agile won’t bring much value to a company.
Agile metrics help monitor productivity across the stages of the software development life cycle (SDLC). In this post, we’re going to discuss agile metrics that matter for success. We’ll take a look at why they’re important for a firm.
But, agile alone doesn’t always help a company succeed in delivering quality work in time. For reducing excessive expenses, activities, and labor, lean is there. Lean and agile together result in a fast and bug-free application that ensures client satisfaction. Lean and agile also eliminate waste that causes a company to lose money. After discussing agile metrics, we’ll move on to lean metrics and their importance. Apart from agile, we’ll also take a look at a few lean metrics essential for a company’s success.
So, let’s dive into the details.

What Are Agile Metrics?
Metrics are nothing but standards of measurement. Agile metrics are standards that help a software team in monitoring how productive a team is across the different phases of the SDLC.
Agile metrics are an essential component of the development process. For companies or teams that work on the agile framework, agile metrics help in assessing software quality.
By measuring how productive a team is, agile metrics help keep the team performance in check. If there are any loopholes, they expose them at the initial stages. Since the data and its usage are measurable, it’s easier to work on the shortcomings with the help of these metrics. For example, velocity metrics can help you track your team’s output.
Importance of Agile Metrics
Now that we know what agile metrics are, let’s break down how they work. The entire concept of agile rests on continuous improvement (CI). But this isn’t something that you can impose on teams. It has to come from within. In short, self-improvement (SI) is a must. So, it’s safe to say that CI isn’t possible without SI.
Immediate delivery is an important component of agile. But one shouldn’t overlook SI in this case. Teams practicing SI give better results than those who don’t. But having a sustainable and effective SI is not child’s play. It’s a long-term process and needs a management framework. By tracking software quality and team performance, agile metrics support SI. In a way, these metrics directly impact CI through effective performance tracking.
Apart from improving continuity, delivering a high-quality product is also a vital part of agile. However, striking the balance between these two can be challenging. This gives rise to the need for metrics against which teams can measure progress. All in all, agile metrics help teams become self-managing. They also help firms in delivering value. At the same time, CI becomes a part of the workflow without much effort.
Agile Metrics Important for Your Project
Agile metrics measure different aspects of projects' development, providing valuable insights and guidance for an agile team. Here are some agile metrics important for your project. They’ll help you understand the development process better. Additionally, they’ll ease the process of overall software release.
1. Sprint Burndown Report
An agile framework comprises scrum teams. They organize their processes into sprints. Since a sprint is time-bound, it’s important to track task progress frequently. A sprint burndown report is for tracking the completion of different tasks during a sprint. Time and work left to complete are the two main parameters of measurement in this case. The X-axis refers to the time. The Y-axis represents the work left. The unit of measurement is hours or story points. The team forecasts the workload at the beginning of a sprint. The target is to complete the workload by the end of the sprint.

2. Velocity
Velocity measures the average work a team does during a scrum sprint. The report, in this case, contains several iterations. The accuracy of the forecast depends on the number of iterations. The more iterations, the more precise the forecast. The unit of measurement is hours or story points. Velocity also determines the ability of a team to work through backlogs. As time passes, velocity tends to evolve. To ensure consistent performance, it’s important to track velocity. If the velocity declines, it’s a sign that the team needs to fix something.

3. Epic and Release Burndown
Unlike a sprint burndown, epic and release burndown focus on the bigger picture. They track progress over a large work body. There are many epics and versions of work in a sprint. So, it’s important to track their progress as well as each sprint. The entire team has to be aware of workflow in the epic and version. Epic and release burndown charts make that possibe.

4. Control Chart
In agile, control charts focus on the time duration from the “in progress” to “complete” status of tasks, enhancing predictability. Their purpose is to check the cycle time of a single issue. Teams with consistency in cycle times have predictable deliveries. Besides this, teams with short cycle times have a high throughput. When teams measure cycle times, they improve the flexibility of their processes. For instance, in the case of changes, you can discern the results instantly. As a result, team members can make the necessary adjustments. In general, a short and consistent cycle time is the target to achieve in every sprint.

5. Cumulative Flow Diagram
The cumulative flow diagram (CFD) ensures consistency in workflow across the team. The X-axis represents time. The number of issues is on the Y-axis. Ideally, the diagram should be smooth from left to right. Smoothen out the color bands in case of uneven flow. The band narrowing means throughput is higher than the rate of entry. If the band widens, this means that your workflow capacity is greater than required, and it can be moved elsewhere to smoothen the flow.
The CFD measures the state of the work in progress. With that, you can take measures to speed up the workflow. The diagram provides a clear visual representation of bottlenecks. You can analyze how bottlenecks formed in the first place. After that, the team can take steps to eliminate them and make improvements.

6. Lead Time
Lead time is the period between the moment of making a request for delivering a product and the actual delivery. All the processes to bring a product to completion come under lead time. It also includes developing a business requirement and fixing bugs. Lead time is an important metric because it provides predictability regarding the time needed for every process. The reason for this is it provides the exact time calculation for every process.
7. Value Delivered
Here, project managers assign value to every requirement. This metric uses either dollars or a points system. Implementing features with high value should be the top priority. An upward trend in this metric shows that projects are on track. On the other hand, a downward trend isn’t a good sign. It means the implementation of lower-value features is going on. If that’s the case, the team should make amends. Sometimes, you might even have to stop product development.

8. Net Promoter Score
Net Promoter Score measures how much the customers are willing to recommend the product or service to others. It’s an index that ranges from -100 to 100. Customer loyalty is an important factor to determine the success of a firm. You can use the Net Promoter Score as a proxy for this purpose.
9. Work Item Age
Work item age is the aging work in progress. This metric indicates the time that passes between the start and completion of the current task. The use of work item age is to detect the timeline for unfinished tasks. By using this metric, you’ll realize how your present tasks move forward. You can also compare your previous performance in the same context as the current scenario. The measurement tool, in this case, is the aging work in progress chart.

10. Throughput
Throughput measures average tasks processed in each time unit. You can also call it a measure for story points per iteration. It represents an agile team’s productivity level. Throughput helps you understand the effect of workflow on business performance. You can get a better overview of the capacity of your team. However, it doesn’t show the starting point of tasks.
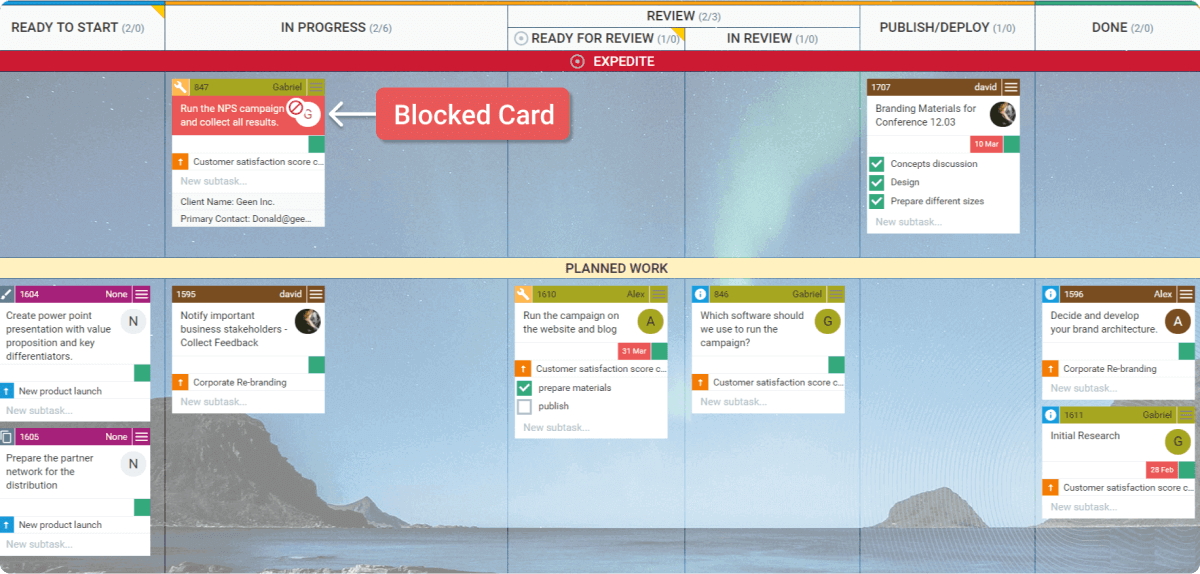
11. Blocked Time
This metric assigns a blocker sticker to a task. It means that due to some reason, the assignee can’t proceed with a particular task because of some dependency. As soon as the dependency is fulfilled, you should move the blocked card to the right on the task board. Count the number and duration of blocked cards for measuring the number of blockers. Resolving the blockers will allow you to finish your “in progress” task quickly.
12. Escaped Defects
When there are bugs in production, it causes a lot of unexpected damage. They pose problems, and the team needs to address them. Escaped defects metrics help in bug identification when a release enters production. You can assess the quality of the software in a raw form. For more information on automated defect minimization, check out Plutora’s solution for test management.
13. Failed Deployments
Failed deployments is a useful quality metric. It helps in assessing the number of overall deployments. Moreover, teams can determine the reliability of the testing and production environment. This metric also determines whether a scrum sprint is ready to enter production.
14. Code Coverage
Code coverage measures the percentage of code unit tests cover. You can run this metric with every build. It represents the percentage of code coverage in raw form. This metric gives a decent perspective on progress. But it doesn’t cover other kinds of testing. Thus, high code coverage numbers don’t necessarily represent high quality.
15. Quality Intelligence
The quality intelligence metric is a must if you’re looking for clarity on software quality. It helps in identifying recent code changes. Suppose there are new codes that the team has developed but testing is yet to be done. Maybe there are instances where the quality declines in those codes. Quality intelligence helps determine the same. It makes the team aware of when they should invest more time in testing.
Agile delivers value to both employees and customers. The metrics that we discussed help to optimize the development process in an agile framework. Agile metrics are development centric. But to optimize the production processes, lean is the way to go. Both agile and lean empower teams to deliver better value. They also focus on quick delivery of value to customers. Let’s discuss lean metrics. We’ll get to know what they are and discuss some lean metrics that are musts to include in your development cycle.
What Are Lean Metrics?
Now that we’ve learned agile metrics in detail, let us move on to lean metrics. The best time for any company is when the sales see a boost. But with improved sales, the workload increases. At the same time, development operation grows. This makes it difficult to measure performance efficiency. Sometimes, measuring performance under a high workload compromises a product’s quality. This process has to be efficient and profitable. So, companies often use lean metrics to evaluate and measure their performance.
Most companies focus on reducing waste to improve production efficiency. But before jumping on to lean management, it’s important to know the measurement of various factors. Lean is all about removing something that doesn’t add value. Lean metrics track and reflect improvements in development and operations. They also control and monitor development processes. This ensures continuous quality to customers. In a way, it identifies areas of improvement. This makes the implementation of changes simpler.
Importance of Lean Metrics
Efficiency is the core of every company’s profits. Maximizing productivity and reducing waste are the top priorities. So, how does a firm achieve these? The answer is simple: by applying lean principles. Lean operations reduce labor and material wastage and boost productivity. At the same time, they also improve the level of production. Lean management includes keeping minimum inventories according to need. It also involves minimizing transportation losses and downtime.
Lean metrics are important for a successful lean operation. They help in making businesses sustainable. As lean improves efficiency, employees can focus on innovation. In the end, the product developed has a great quality and fewer bugs.
Lean Metrics Important for Your Project
Wasteful practices cause damage to a company by increasing costs. The only thing customers want to pay for is value. And that’s exactly what lean metrics help in increasing. Do you know what professional runners do to increase their chances of victory? They time their sprints and strive to improve each time. Even if the improvement is in the form of a few seconds, it brings them closer to the finish line in less time. And that’s what gives them the final win!
Similarly, lean metrics help in cutting down waste. Even if the quantity of waste reduction is less, every step counts. Runners track metrics like time, distance, heart rate, pace, and elevation. In the same way, companies following lean management have to use lean metrics to ensure their success. So, let’s take a look at some lean metrics important for your projects.
Lean Metrics to Improve Flow
Speedy delivery and operational success are musts for successful lean management. But they’re not possible without a smooth workflow. So, on that note, let’s check out the lean metrics needed to improve flow.
1. Queues
There are waiting periods between different task stages. Instead of limiting the time during active work, reduce the waiting time in queues to manage the backlog effectively. Identify where the task is stuck using efficiency diagrams. After that, take measures to cut down the work in queues.
2. Throughput
It’s important to calculate items processed under a specified time period. It helps in assessing the quantity of work across a time period. You can also keep track of how it impacts business decisions. For the best results, use throughput as a trend. Another effective way is to combine its use with other metrics.
3. Little’s Law in Practice
Calculation of cycle time uses a variation of Little’s Law. When we divide work in progress (WIP) with the average completion rate of a task, it gives the cycle time. The formula states how changes impact the final output. The law shows how increased WIP can result in more cycle time.

Lean Metrics to Improve the Speed of Delivery
In the current Age of Agile, customers want companies to deliver their product quickly. Thus, every business needs speedy delivery to thrive. Here are some lean metrics that improve the speed of delivery.
1. Blockers
Blockers are visual icons that represent a task that’s unable to move forward. This can be due to a failure condition or an external dependency. A blocked task needs immediate attention. Thus, this metric draws the attention of the team to something urgent. When a team member hovers over the icon, it reveals the reason behind the blockage.
2. WIP (Work in Process or Work in Progress)
When a task has crossed its starting point, it’s important to measure the time it takes to reach the end. When you track tasks that are in progress, it helps improve delivery speed. This way, teams focus on existing tasks before starting new ones and can work efficiently and quickly.
3. Cycle Time and Lead Time
The time from when a company receives an order to when it delivers it is the lead time. Lead time also includes processing time. But since wait states and processing time are a part of lead time, it becomes difficult to gain the exact insights. This is where cycle time comes into the picture. It includes the time between when a task is first active to when it reaches the point of review. Cycle time helps grasp the impact of different changes in the overall process.
Lean Metrics for Operational Success
The seamless functioning of changes is an important part of lean management. Operational success in lean increases profitability and efficiency. On that note, let’s take a look at the lean metrics for operational success.
1. Total Cost
This metric enables the team to compare costs between two manufacturing periods. Analyze how much you spent in the last manufacturing period. Then compare those metrics with the current manufacturing period. As time progresses, you should spend less and gain more. When you have a clear idea of where your company lies monetarily, it helps cut costs over time.
2. Delivery Performance
Delivery performance is the ability of your operations to meet customer requests. It’s a KPI measurement that measures the fulfillment of the demands of customers in terms of delivery dates. The delivery performance is high if your deployment policies are in line with delivery promises.
3. Safety
This KPI uses conventional accident/incident frequency and severity metrics. Switching to lean operations reduces waste. Thus, it improves performance and saves time. By reducing floor incidents, it also saves money and resources.
Wrapping It Up
Implementing agile metrics brings more clarity to development. Agile is so hyped that companies make the switch without thinking twice. But the fact is that merely switching from traditional practices to agile is not enough. Bottom line—stop expecting miracles from agile if you haven’t implemented it properly. Performance tracking and agile metrics are a must for the full implementation of agile. If you’re really aiming for success, keep the above agile and lean metrics in mind. Make them a part of your workflow. In some time, it’s highly likely that you’ll see your company reach heights you never imagined!


Download our free eBook
Mastering Software Delivery with Value Stream Management
Discover how to optimize your software delivery with our comprehensive eBook on Value Stream Management (VSM). Learn how top organizations streamline pipelines, enhance quality, and accelerate delivery.


